
Connect. Secure. Manage.
Network Monitoring and Telemetry
Design Cisco and Meraki monitoring around actionable evidence, combining device health, traffic visibility and protected collection with clear alert ownership.
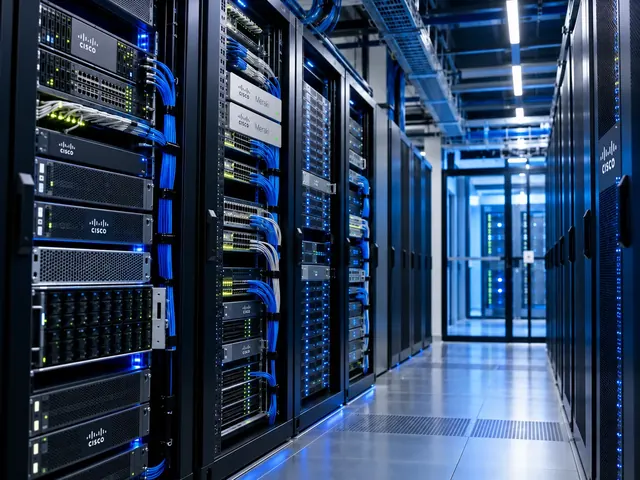
Devices supported
across the UK
Client locations
supported
Traffic handled
at peak time
Average
response time
Average response is not a resolution time or a contractual guarantee. Support scope and response commitments are agreed for each engagement.
Network monitoring and telemetry help teams see faults, trends and the effect of changes. We choose data around the Cisco and Meraki services you need to protect. Each useful alert needs someone who can act on it. The design covers access to the data and the other services that monitoring itself relies on.
Useful visibility
Monitor service-relevant conditions rather than collecting alerts without ownership.
Controlled change
Keep maintenance, automation and configuration work reviewable and recoverable.
Clear escalation
Connect incidents to the right engineering, provider and business contacts.
Begin with operational questions
We establish what the business and engineering teams need to know. Questions may include whether a site has lost resilience, which path carries an app, whether a link is congested or when a change to the settings affected service. Each question suggests different data and a different observation point.
This approach avoids treating one technology as a complete answer. Device polling, streaming telemetry, flow records, logs and synthetic tests each reveal part of the picture. We select a suitable combination and record the limits of each source, rather than claiming that an online device proves every app path is healthy.
Standards & partnerships
Confidence in the team behind your network.
 Cisco Partner
 Cisco Meraki
 Cyber Essentials
 Cyber Essentials Plus
MCI Network Services is operated by Proxar Ltd. Certifications apply to the certified legal entity and the scope of its certificates. View accreditation information
Map coverage to the actual estate
The monitoring inventory includes sites, devices, interfaces, controllers, cloud-managed platforms and relevant external dependencies. We link technical components to the services they support so alerts carry useful context. A critical connection should not be overlooked because it is represented by an ordinary interface name in an inherited system.
Coverage is reviewed when the estate changes. New devices, replacement interfaces and renamed networks can create gaps or duplicate checks. We set out how assets enter and leave monitoring and who checks that the resulting observations still represent the approved service scope.
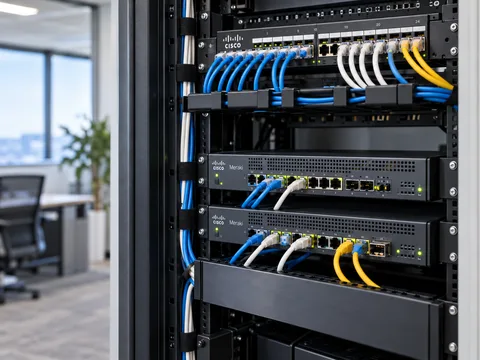
A useful starting point
Tell us what is happening.
A short description of the problem is enough for an initial discussion.
Select supported collection methods
Cisco platforms differ in the counters, models and export methods they support. Meraki services may expose particular information through dashboard functions, APIs or alerts. We check the actual hardware, software and entitlement before specifying a collection method, avoiding assumptions that every platform provides the same granularity.
Collection frequency and data volume also require a decision. More frequent observations can reveal short events but increase device, network and storage load. We choose intervals according to the question being answered and the supported capacity, rather than using the most aggressive settings everywhere.
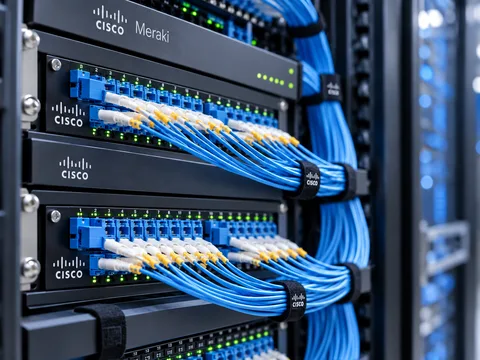
Different environments. The same care.
Built around the work
your network supports.
Finance, banking and the wider private sector. We start with the systems and people that depend on your connections.
Finance & banking
Market-data paths, routing and provider coordination on clients’ behalf.
Financial-market services ↗Offices & multi-site teams
Reliable access between people, workplaces and business applications.
Office network design ↗Data centres & cloud
Network boundaries, workload connections and operational ownership.
Data centre networks ↗Protect the collection path
Monitoring access is scoped to the data and functions required. We review authentication, network restrictions, encrypted transport where supported and the storage of credentials. Read-only collection should not accidentally provide a route for unrestricted changes to the settings.
Collected information may reveal addresses, users, app relationships or operational patterns. We agree access, retention and sharing with the customer and relevant security owners. Technical data should not be labelled anonymous simply because it came from a switch rather than a web form.
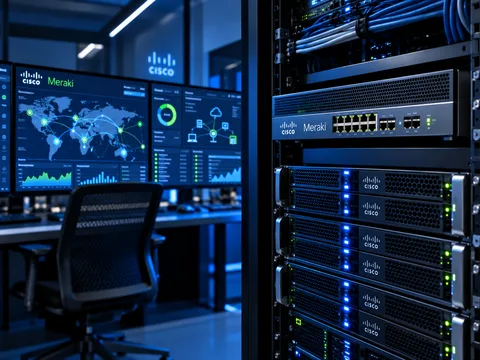
Turn observations into useful alerts
An alert needs a meaningful threshold, severity and owner. We consider normal behaviour, redundancy and downstream dependencies so a single upstream problem does not create an uncontrolled stream of unrelated incidents. Planned maintenance and approved exceptions are represented clearly and reviewed when they expire.
The collection system itself needs monitoring. Stale data, failed subscriptions or a broken notification route can make a dashboard look reassuringly quiet. We set out how operators recognise those failures and distinguish missing evidence from evidence that the network is healthy. The collector and notification path each have their own support owner.
Correlate evidence during investigation
Time alignment and consistent identifiers help engineers combine logs, interface measurements, flow records and app reports. We document where timestamps originate and what delays or aggregation affect the data. A graph sampled over several minutes may not resolve the short event described in an app log.
The investigation process separates observations from conclusions. A path change occurring near an app fault is useful evidence. But it is not automatic proof of cause. We use targeted tests and relevant platform diagnostics to narrow the explanation before recommending a production change.
Build an operating process around the tools
The handover includes coverage, data sources, thresholds, access ownership and the response expected for important events. Reports should identify recurring problems and actions rather than merely reproducing dashboards. The customer also needs a route for reviewing whether the monitoring remains appropriate as apps and sites evolve.
MCI can implement a new collection design or improve a current system through monitoring noise reduction, telemetry integration and service reviews. The work can support a NOC or an internal team, with ongoing response commitments agreed separately from the technical installation. The result is evidence that engineers can trust and use, not a larger volume of unattended alarms.
Talk to a specialist
Need a specialist view?
Tell us what is affected, what changed and what your team has already checked. A short outline is enough to start.
+44 203 196 6566Choose option 1
sales@proxar.co.ukUK-wide service.
Most of our engineers are based in Kent, with a focus on London, Sussex, Essex and Berkshire.
Existing customers should use their agreed support and escalation channels. This form is for service enquiries, not a monitored emergency ticket.
Tell us what you need.
A short outline is enough. Please do not include passwords or sensitive network details.
Thank you. Your enquiry has been submitted.
Please check your name, email and message, then try again.
Your form session expired. Please try again.
Please wait a minute before sending another enquiry.
We could not submit your enquiry. Please call or email us instead.