
Connect. Secure. Manage.
Cisco NetFlow and IPFIX Analysis
Collect and analyse supported Cisco traffic-flow data to understand application paths and usage, with retention, access and privacy boundaries defined.
Devices supported
across the UK
Client locations
supported
Traffic handled
at peak time
Average
response time
Average response is not a resolution time or a contractual guarantee. Support scope and response commitments are agreed for each engagement.
Cisco NetFlow and IPFIX analysis uses flow records to show which systems communicate and how traffic changes. These records are not a full packet capture. We plan collection around the question you need to answer and explain the effect of sampling and settings. Access rights, retention and gaps in the measurements are kept clear.
Useful visibility
Monitor service-relevant conditions rather than collecting alerts without ownership.
Controlled change
Keep maintenance, automation and configuration work reviewable and recoverable.
Clear escalation
Connect incidents to the right engineering, provider and business contacts.
Define the investigation or reporting purpose
A customer may need to identify major traffic sources, understand a congested WAN link or investigate an unexpected communication pattern. We establish the question before selecting interfaces and record fields. Collecting every possible field across the estate can create cost and complexity without improving the answer.
We also identify the relevant observation points. Traffic seen before translation or tunnelling can differ from what is visible after it, and one exporter may not represent both directions. The analysis records these boundaries so a report does not attribute a translated address or encapsulated flow to the wrong service.
Standards & partnerships
Confidence in the team behind your network.
 Cisco Partner
 Cisco Meraki
 Cyber Essentials
 Cyber Essentials Plus
MCI Network Services is operated by Proxar Ltd. Certifications apply to the certified legal entity and the scope of its certificates. View accreditation information
Verify supported exporter behaviour
Cisco platforms differ in their flow features, hardware support and export formats. We check the actual model, software and interface capabilities before specifying a record. The collector must understand the templates and fields it receives, not merely accept packets on an export port.
Sampling, cache behaviour and export timing affect interpretation. A sampled view may be suitable for capacity trends but cannot be treated as an exact record of every connection. We document the chosen settings and their limits, especially when the customer wants to investigate small, brief or infrequent traffic patterns.
A useful starting point
Tell us what is happening.
A short description of the problem is enough for an initial discussion.
Select fields and interfaces deliberately
The flow record should include the information needed for the agreed question without unnecessary collection. We consider addresses, ports, protocol, interface context and relevant counters according to platform support. Application labels or classifications are interpreted with their source and limitations, rather than assumed to be infallible identification of user activity.
Observation direction matters. Collecting the same traffic at several points can be useful for path analysis, but combining those records indiscriminately can double-count demand. We set out how exporters and interfaces are distinguished so the resulting report represents the intended service boundary.

Different environments. The same care.
Built around the work
your network supports.
Finance, banking and the wider private sector. We start with the systems and people that depend on your connections.
Finance & banking
Market-data paths, routing and provider coordination on clients’ behalf.
Financial-market services ↗Offices & multi-site teams
Reliable access between people, workplaces and business applications.
Office network design ↗Data centres & cloud
Network boundaries, workload connections and operational ownership.
Data centre networks ↗Build a reliable collection path
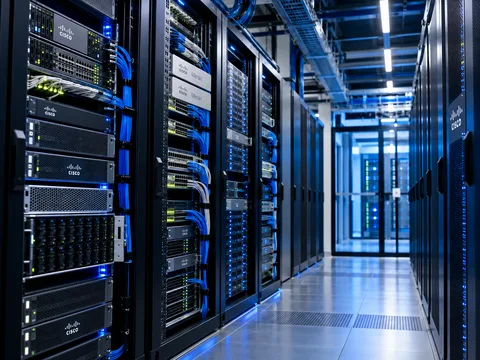
Export traffic, templates and collector resources are planned together. Missing templates or ingestion failures can make valid records unusable, while an overloaded collector may produce incomplete reporting without an obvious network fault. We monitor collection health and record gaps rather than treating an empty chart as evidence of no traffic.
Time alignment supports correlation with incidents and other telemetry. Export intervals can delay when activity becomes visible. So the report should not imply packet-level timing precision that the data does not provide. We explain the observation and export behaviour when interpreting a short app interruption.
Protect the information collected
Flow metadata can reveal communication relationships, addresses and patterns associated with people or business activity. We agree authorised access, retention and sharing before enabling collection. It should not be described as anonymous merely because it normally lacks full app payloads.
The exporter and collector are placed within an appropriate management and security design. Where transport protection is not available in the chosen rollout, the network path and exposure are assessed clearly. Credentials and admin access to the collection system receive the same care as other operational platforms.
Analyse findings in context
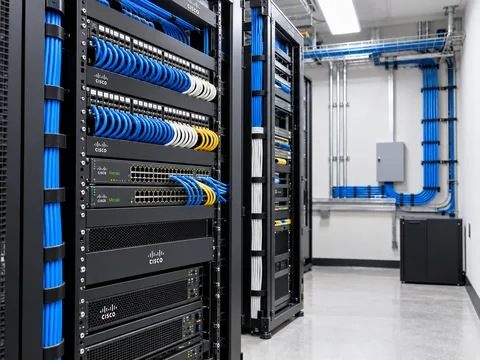
We compare flow evidence with interface counters, routing, logs and the customer’s app knowledge. A large traffic source may be a legitimate backup rather than misuse, and a missing flow may reflect sampling or an observation gap. Findings distinguish what the records show from conclusions that require another test.
Recommendations can involve scheduling, capacity, routing policy or a more detailed investigation. We avoid changing production solely because a dashboard ranks an app as a top user. The proposed action is tied to business impact and checked after rollout using comparable measurements.
Leave a usable evidence and operating record
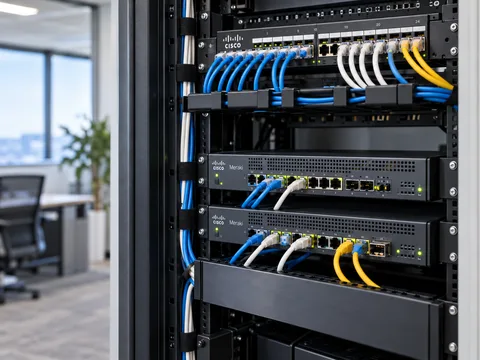
The handover identifies exporters, records, sampling, templates, retention and reporting assumptions. Operators receive guidance on collection failures and the limits of the data. Future changes to interfaces, software or translation paths should trigger a review of whether the reports still mean what users expect.
MCI can deploy flow analysis within network monitoring and telemetry or use it for a defined Cisco investigation. The engagement provides an evidence-led view of network demand and communication, not a claim that flow records replace packet analysis, endpoint logs or the customer’s wider security and privacy duties.
Talk to a specialist
Need a specialist view?
Tell us what is affected, what changed and what your team has already checked. A short outline is enough to start.
+44 203 196 6566Choose option 1
sales@proxar.co.ukUK-wide service.
Most of our engineers are based in Kent, with a focus on London, Sussex, Essex and Berkshire.
Existing customers should use their agreed support and escalation channels. This form is for service enquiries, not a monitored emergency ticket.
Tell us what you need.
A short outline is enough. Please do not include passwords or sensitive network details.
Thank you. Your enquiry has been submitted.
Please check your name, email and message, then try again.
Your form session expired. Please try again.
Please wait a minute before sending another enquiry.
We could not submit your enquiry. Please call or email us instead.