
Connect. Secure. Manage.
Nexus Dashboard Insights
Configure supported Nexus Dashboard observability and assurance capabilities, selecting useful telemetry and establishing actionable review processes.
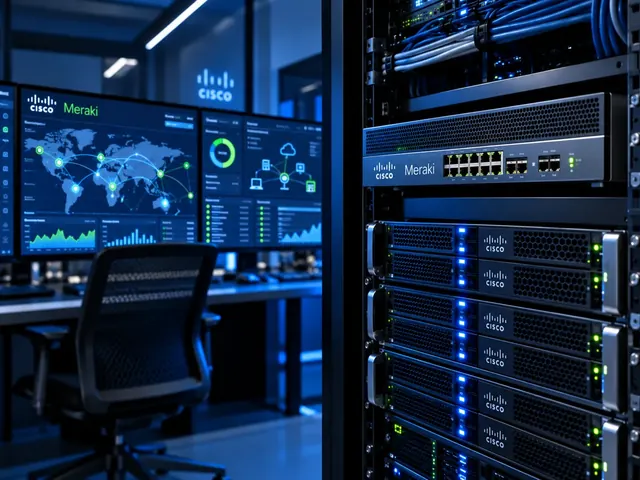
Devices supported
across the UK
Client locations
supported
Traffic handled
at peak time
Average
response time
Average response is not a resolution time or a contractual guarantee. Support scope and response commitments are agreed for each engagement.
Nexus Dashboard Insights helps teams turn data from a Cisco fabric into useful findings. The features and names vary by release, so we start with what your platform supports. We then choose the data to collect and how findings will be reviewed. Each useful alert needs an owner and a clear next step.
Workload-led design
Start with application, compute and storage dependencies rather than the switch model.
Clear failure domains
Understand which links, devices and sites can fail together.
Operational clarity
Make fabrics, external routing and management responsibilities supportable.
Define the questions the team needs to answer
Useful visibility begins with operational questions: where is capacity becoming constrained, which change preceded a fault, or why does one app path behave differently from another? We find the services and duties behind those questions. This prevents a rollout from collecting every available metric without a clear reason or anyone assigned to act on it.
The assessment records the supported fabrics, switches and software versions. We distinguish functions available in the chosen release from capabilities described for another product generation. Existing Insights terminology may still be relevant to the customer’s estate, while newer unified interfaces can organise the same operating tasks differently. The service follows checked capability rather than promising a particular screen or feature universally.
Standards & partnerships
Confidence in the team behind your network.
 Cisco Partner
 Cisco Meraki
 Cyber Essentials
 Cyber Essentials Plus
MCI Network Services is operated by Proxar Ltd. Certifications apply to the certified legal entity and the scope of its certificates. View accreditation information
Select telemetry with appropriate coverage
We review what the platform can collect from the actual devices and how that information relates to the intended questions. Collection intervals, data availability and retention affect the conclusions that can be drawn. A coarse metric may miss a short burst, while a detailed event may have limited historical coverage. Those limitations are documented rather than hidden by a convenient chart.
Monitoring coverage also needs to include the right boundaries. A fabric view may not explain a problem in an external firewall, WAN path or app server. We identify where extra evidence is required and how it can be correlated. The platform is one source of operational information, not a guarantee of complete visibility into every system on the service path.

A useful starting point
Not sure where to start?
Bring the requirement. We will help you define the engineering work.
Protect access and operational information
Telemetry can contain addresses, topology and settings that are sensitive even without app payloads. We agree who can view, export and share the data and how it is retained. Administrative and service-account permissions are aligned with the intended functions. Access to a troubleshooting platform should not automatically provide unrestricted authority to change the network.
The rollout also depends on reliable clocks, network access and identity services. We check those prerequisites because inconsistent timing can undermine event correlation and failed collection can look like an absence of faults. The operating procedure distinguishes a healthy monitored network from a monitoring system that has stopped receiving useful evidence.
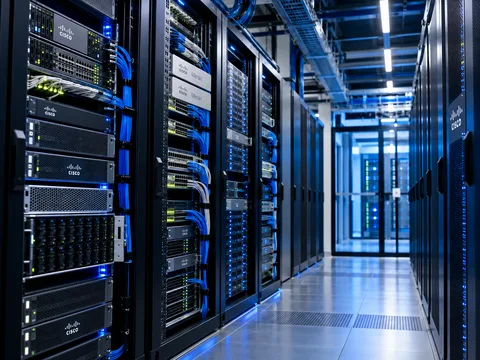
Different environments. The same care.
Built around the work
your network supports.
Finance, banking and the wider private sector. We start with the systems and people that depend on your connections.
Finance & banking
Market-data paths, routing and provider coordination on clients’ behalf.
Financial-market services ↗Offices & multi-site teams
Reliable access between people, workplaces and business applications.
Office network design ↗Data centres & cloud
Network boundaries, workload connections and operational ownership.
Data centre networks ↗Tune findings around service impact
Not every reported anomaly requires an urgent incident. We classify findings according to the affected service, loss of resilience and the action a responsible team can take. Repeated low-value events are reviewed for their cause rather than simply suppressed. The aim is to reduce distraction without hiding a developing fault or an unsupported setup.
Thresholds and exceptions are documented with owners. A temporary maintenance condition should not become a permanent ignored alarm. Where a finding is uncertain, the response can be investigation rather than automatic correction. We avoid treating an analytic recommendation as proof that a production change is safe without reviewing the customer-specific context and the possible effect on other services.
Test investigation and escalation workflows
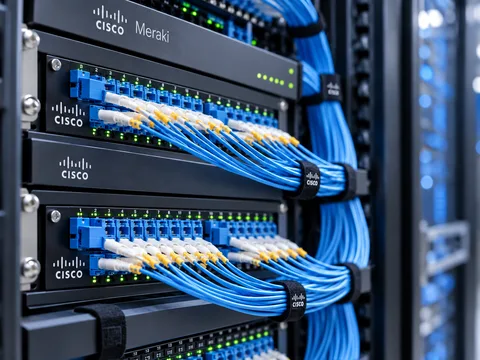
A representative scenario shows how an engineer moves from a finding to the relevant topology, device evidence and app owner. We check whether the information can support a useful internal or vendor escalation. The test should expose gaps in access, retention or responsibility before a real incident depends on the workflow.
Where integrations with ticketing or monitoring are included, we check the content and routing of the resulting records. Duplicate incidents, missing identifiers and excessive severity can undermine otherwise useful visibility. The acceptance record states what was shown and which external systems or processes remain outside scope. A successful data feed alone is not complete operational integration.
Maintain the value of the platform
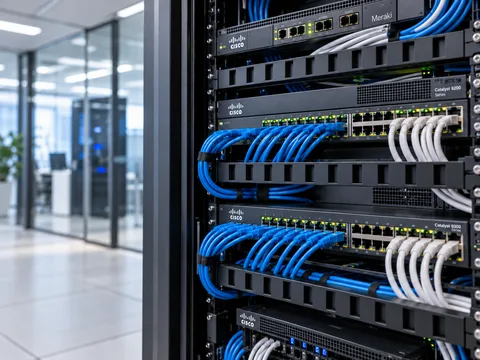
The handover includes monitored scope, useful findings, retention decisions and review routines. Capability changes after an upgrade are assessed against the original operational questions. New fabrics and apps may require different measurements, while retired services should be removed from reports and alert rules. This keeps the platform aligned with the estate rather than accumulating obsolete dashboards.
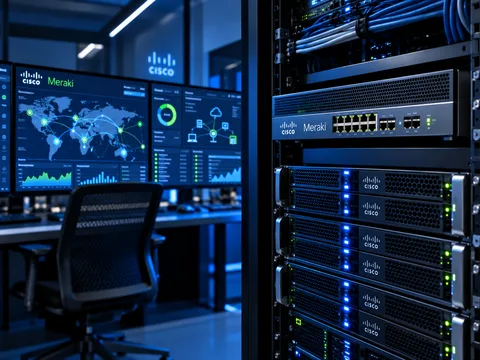
MCI can improve a current rollout or include observability work in a Nexus Dashboard project. Our network monitoring and telemetry services can connect fabric observations with wider service evidence. Provide the current platform versions and the questions your team struggles to answer, and we will define a supported, measurable improvement scope.
Talk to a specialist
What does your network need next?
Tell us what you are planning, changing or trying to improve. We will help define a practical next step and the engineering scope.
+44 203 196 6566Choose option 1
sales@proxar.co.ukUK-wide service.
Most of our engineers are based in Kent, with a focus on London, Sussex, Essex and Berkshire.
Existing customers should use their agreed support and escalation channels. This form is for service enquiries, not a monitored emergency ticket.
Tell us what you need.
A short outline is enough. Please do not include passwords or sensitive network details.
Thank you. Your enquiry has been submitted.
Please check your name, email and message, then try again.
Your form session expired. Please try again.
Please wait a minute before sending another enquiry.
We could not submit your enquiry. Please call or email us instead.